


Live football heat map: how to read it
4 min read · InstagramThe heat map shows where each team attacks and how intensely, minute by minute. How to read the zones, the flanks and what they say about corners.
A football heat map shows where each team is attacking and how intensely: the stronger the colour in a zone, the more attacking presence the team has there. On CornerPro it updates minute by minute and splits the attack into three lanes (left, centre and right), which helps you see whether a match is heading towards crosses and corners or towards shots through the middle.
This guide covers what the heat spots mean, how to read Active Attack and Intensity, and what each lane tells you about corners.
What is a heat map in football?
It is a picture of the pitch where the areas a team uses most appear "hotter". On CornerPro the Heat Map is a live tool: rather than summing up the match at the end, it shows where the game is being played at each moment.
Its value lies in what the score and possession do not tell you. Two teams can each have 50% of the ball while one is camped in the opposition box and the other is only passing it around in its own half.
What do the heat spots mean?
- A strong spot in the opponent's box: the team is genuinely attacking and may create scoring chances.
- Spots near the touchlines: more presence down the flanks, which usually leads to crosses.
- Spots in a team's own half: a side sitting deep or unable to get out.
The more intense the spot in the opponent's half, the clearer the signal that the team is pushing.

Active Attack and Intensity by third of the pitch
CornerPro's Heat Map gives you two readings:
- Active Attack: the area of the pitch where each team is applying the most attacking pressure, shown as percentages by lane.
- Intensity: the level of attacking pressure in each third of the pitch.
Together they answer two different questions: where a team is attacking, and how hard.
Left, centre and right lanes, and what they mean for corners
The lanes are the most useful part for the corners market:
- Attacks down the flanks with strong presence in the final third: more crosses, more balls blocked behind by defenders, more corners.
- Attacks funnelled through the centre: more shots and combination play, but fewer corners.
So for corners, the matches worth watching are the ones where one team, or both, attack wide and regularly reach the areas near the corner flag.
Real example: Portugal vs Armenia
In a Portugal vs Armenia 2026 World Cup European qualifier, the Heat Map showed Portugal with 73% attacking-area presence, split 39% on the left, 32% through the centre and 29% on the right. Armenia had only 27%, with 51% of their play through the centre.
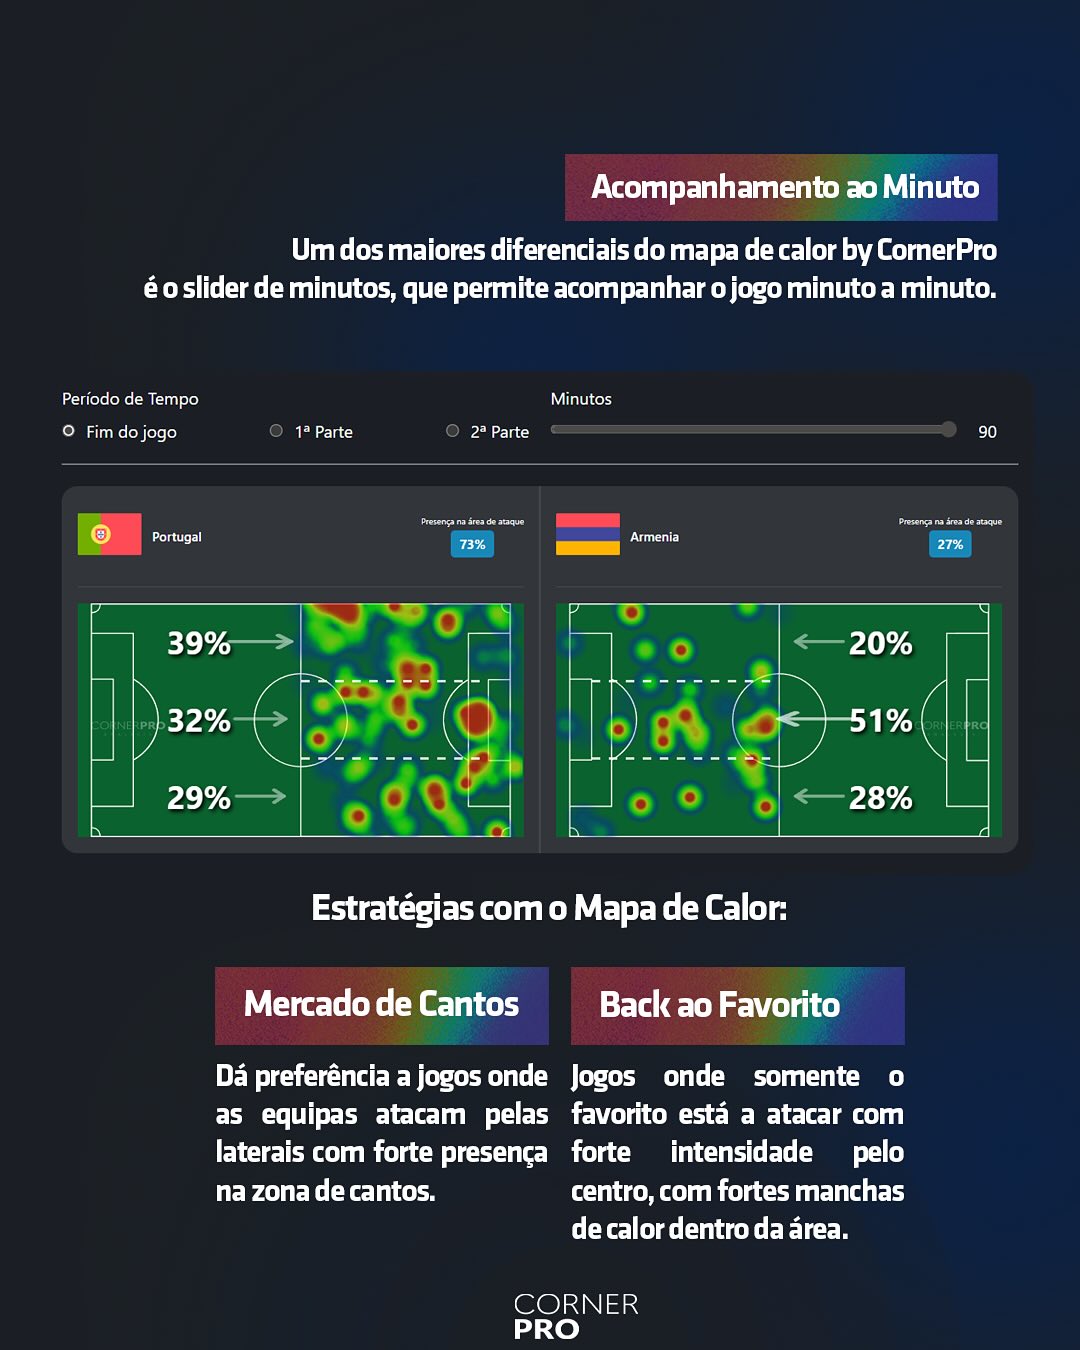
How to read it: Portugal attacked a lot and across the whole width, with a slight lean to the left. That width is the kind of profile that tends to produce corners. Armenia not only attacked little, they did it mainly through the middle, which produces fewer corners.
How to follow a match minute by minute
One of the Heat Map's strengths is the minute slider. You can move it and watch how the split changes through the match, instead of looking only at the total. That is how you catch the shifts: a team that started deep and from the 60th minute poured forward down the right, or a favourite that dominated the first half hour and then faded.
Football heat map app
CornerPro's Heat Map can be followed live on the website and in the app, on the Live page and on each match page, so you can keep an eye on several matches at once from your phone.
Frequently asked questions
Does the heat map tell you who will score? No. It tells you where and how intensely each team is attacking. For chance quality, look at xG; for pressure over time, the Pressure Graph.
What counts as a high attacking presence? It depends on the match. What matters is the gap between the two teams and how it changes minute by minute.
Why do attacks down the flanks produce more corners? Because crosses and wide play often end with the ball cleared or blocked behind the goal line by a defender.
Where can I find the heat map? On CornerPro's Live page and on the page of every match in progress.
Related tutorials
Looking at the Heat Map, which type of match is more interesting for the corners market?
Answer to mark this tutorial as done.