


Football pressure graph: how to read it
5 min readThe pressure graph shows, minute by minute, which team is attacking and how hard. Learn to read bars, colours and shots, and tell pressure from dominance.
The pressure graph shows, minute by minute, which team is attacking and how hard. You read it by the size of the bars (the bigger the bar, the more pressure), by the colour (green for the home side, red for the away side) and by the circles, which mark shots on target and shots off target.
This guide explains each element, the difference between High Pressure and Strong Superiority, and how to combine the graph with other match data.
What is a pressure graph in football?
It is a visual record of each team's attacking pressure over the course of a match, sometimes called a momentum graph. CornerPro's version is built with our own algorithms from in-game events such as shots on and off target. The aim is that one glance tells you who is pushing the opponent back towards their own box and for how long, something the scoreline and possession figures do not show.
It answers a question the result hides: is the match quiet, or is one team about to break it open?
How to read the bars and colours
- Colour: green is always the home team; red is always the away team.
- Side: at any moment the bars appear on one side only, the side of the team applying more pressure.
- Size: this is what measures intensity. Tall bars mean heavy attacking pressure; short bars mean little.
One important detail: a bar on its own does not mean that team is dominating. A run of short bars on one side only says that team is pressing slightly more than the other. If both teams show short bars, the match has little attacking activity at that point.

Circles: shots on target and off target
Two kinds of circle sit on top of the bars:
- Large circle: a shot on target.
- Smaller circle, in a different colour: a shot off target.
The circles separate pressure that produces chances from pressure that only produces approaches. Lots of tall bars with no circles can be a team getting close without shooting. Several tall bars with large circles in a row is different: a team testing the goalkeeper again and again.
High Pressure vs Strong Superiority
These are two separate indicators on the Live page, and each has its own area listing the matches where it is happening:
- High Pressure: flags a specific spell of intense pressure. When one team sharply raises the tempo against the other, the match is highlighted in blue.
- Strong Superiority: flags sustained dominance. It switches on when one team keeps an average Pressure Index at least 10 points higher than its opponent.
In practice, High Pressure means "right now"; Strong Superiority means "across the match". A team can have a spike of High Pressure without being the better side overall, and a dominant team can go ten minutes without a spike.
Real example: Argentina vs Switzerland
In an Argentina vs Switzerland match analysed on CornerPro, the graph showed a clear shift around the 60th minute: the bars moved to Switzerland's side and grew, and within a few minutes three large circles appeared in a row, three shots on target. The pre-match data added context: Switzerland needed, on average, about 3 shots on target to score a goal, and at that point they already had 4. A few minutes later they equalised.
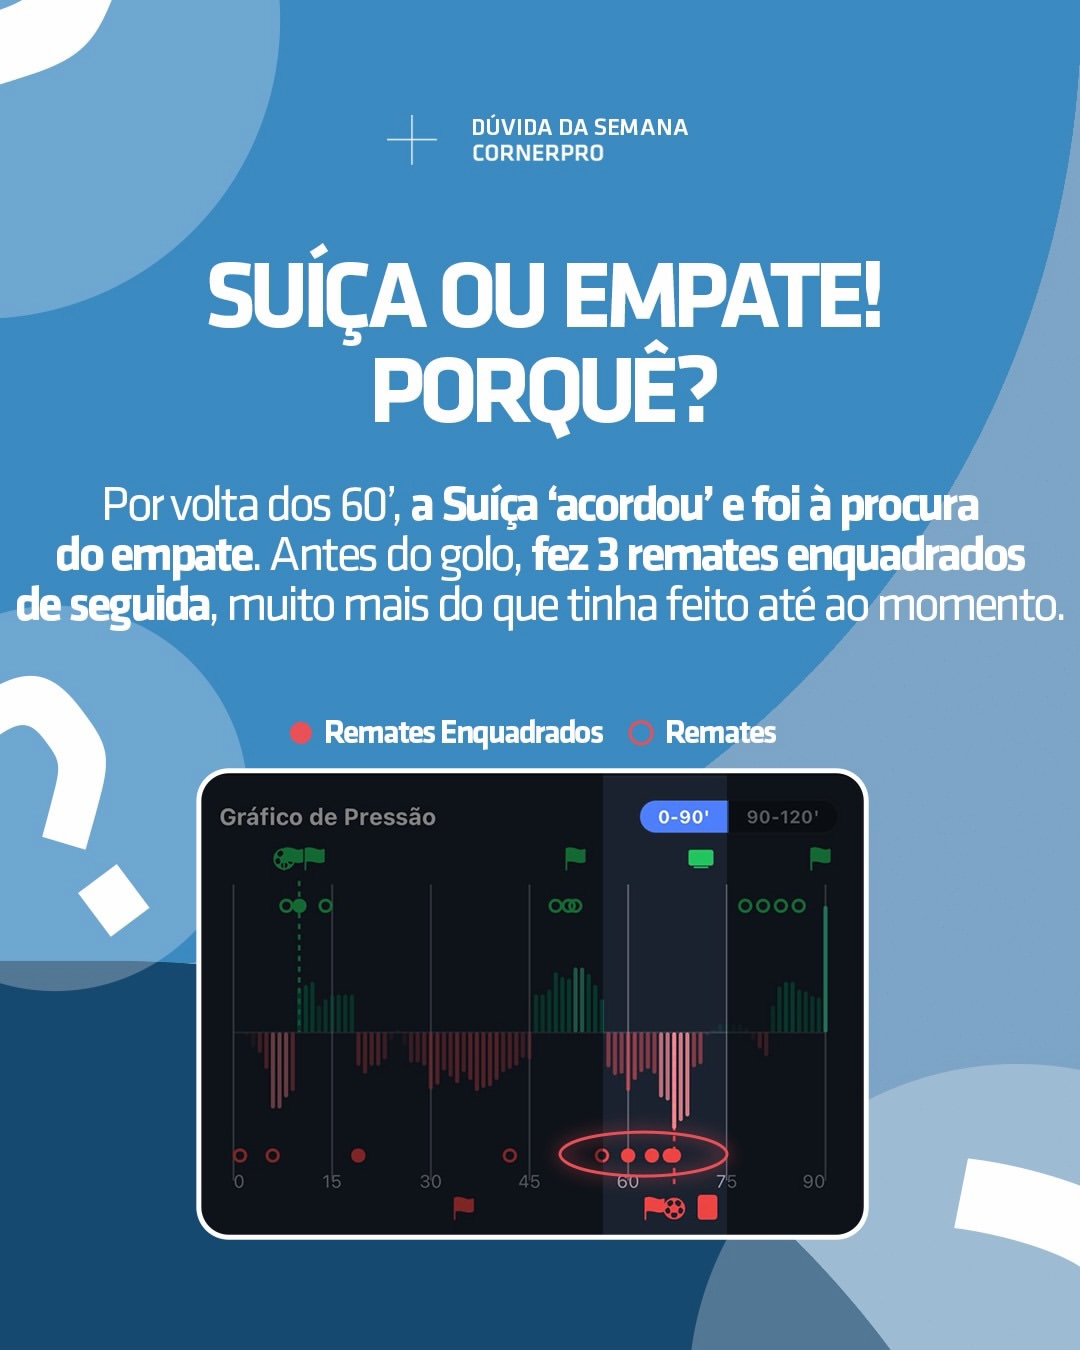
The lesson is not that three shots on target guarantee a goal. It is that the graph made a change in momentum visible before it showed up on the scoreboard.
Using the graph with L15 and the heat map
The pressure graph tells you who is pushing and how hard. Two other tools complete the picture:
- L15: estimates each team's expected pressure over the next 15 minutes. If the graph already shows tall bars and L15 is also high, the pressure is likely to continue.
- Heat Map: shows where the pressure is coming from. Down the flanks it tends to mean crosses and corners; through the middle it tends to mean more shots.
No single indicator decides on its own. The best case is when all three tell the same story.
Frequently asked questions
What does it mean when there are no bars? Neither team is generating meaningful attacking pressure in that spell.
Do tall bars mean a goal is coming? No. They show intense pressure. Whether it becomes a goal depends on the quality of the chances, which is what the circles and xG help you judge.
Where can I see the pressure graph? On CornerPro's Live page, on the card of every match in progress, so you can follow it live minute by minute.
What is the difference between High Pressure and Strong Superiority? The first is a spell of intensity; the second is dominance of at least 10 points of average Pressure Index over the match.
Related tutorials
On the Pressure Chart, both teams have small bars. What does that indicate?
Answer to mark this tutorial as done.